Home

Stocks | History | Signals | Trading | Graphs | Links | Policies | Sign-up | About Us | Guest Book | Newsletters
FeldPro LLC Market Timing System for the NYSE Composite Index
BUY/SELL Signals and History

feldpromkttimelogo3.jpg

                April 15, 2004 Signal  -  SELL


    The NYSE Composite Index opened at 6545.96

We're going to quit showing our last two signals soon.

We will make them available only to subscribers who will be advised by email when our proprietary market timing system issues new signals.

The following chart includes back-tested signals prior to November, 2002 and actual results since that time.

nyse_signals.jpg

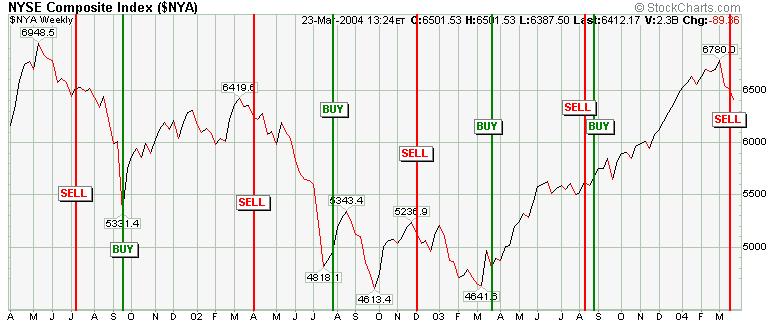
We believe the least volatile investment opportunity is investing in the broad stock market.  This eliminates the risk of seeing individual stocks lose significant value overnight.  The movement of the total market is dampened by the up and down movement of all of the stocks in the market.  Yet the total market does move up from time to time and down from time to time.  It just doesn't move as quickly as some individual stocks.

You can see from our back-tested results that it's possible to have a positive return investing in the broad market, even in a severe downward trending market like 2002.  The key is getting in when the market starts moving up and getting out when it starts moving down.

We developed this market timing system for our own use to spot these pivot points in the broad market.  Back-testing our proprietary system yielded very good results as you can see below. 

Paul A Merriman, Publisher and Editor of Fund Advice.com, has published a number of articles on the value of market timing.  Follow the link below to one of his best articles.

Click here to go to "Best Retirement Portfolio I Know Using Timing"

While past performance in no way guarantees future performance, we are now investing as indicated by our signals Any investment decisions you make are your own decisions. You are responsible for your investment decisions. Nothing you read on this web site should be construed as a recommendation for you to invest in the stock market.

The market timing signals generated by our proprietary system don't catch every up and down movement of the market. The system is designed to identify major changes of direction in the market. A key objective in developing this market timing system was to be able to generate signals early enough after a change in market direction to be able to take advange of the market move.

Notice that our SELL signals occurred early enough after market tops in all cases to avoid losses. Positive gains were experienced in all of the periods when we were in the market. We are really impressed by the ability of our market timing system to allow us to actually make money prior  to 2003 during a time when the market has experienced a sizable retrenchment.

The stock market is driven by a combination of value and emotion. Like all things in nature, the market moves in cycles, sometimes paying a premium for value and sometimes discounting value. Sometimes the market is very optimistic and sometimes the market is very pesimistic. Sometimes there is good news and sometimes there is bad news. All of this results in the market moving to extreme positions from time to time, both on the upside and on the downside. Traders refer to the market being "overbought" and "oversold", meaning that the real value of the market is somewhere between these extremes. Sometimes the market can remain overbought or oversold for extended periods of time.
 
Our market timing system is designed to identify changes in direction of the overall market trend.  These directional changes are hard to spot and no one have ever developed a foolproof system to spot them.  
 
However, market direction is my no means random and by watching a combination of fundamental indicators along with technical indicators we are able to improve our odds of predicting the future direction of the market.  
 
When we think the market is changing directions we will  issue a BUY or SELL signal.

FeldPro LLC Market Timing
NYSE Composite Market Timing Record
As measured by changed in the NYSE Composite Index
Numbers before 11/25/02 are backtested after the fact.

In the Market


In the Market

Out of the Market


Realized Gain/Loss

Avoided Gain/Loss

Signal Date

Action

Price

Change

Percent

Change

Percent

4/17/00

Buy

644.49


8/24/00

Sell

671.94

+27.45

+4.3%


3/22/01

Buy

566.35


-105.59

-16.4%

6/7/01

Sell

645.81

+79.46

+14.0%


9/19/01

Buy

529.38


-116.43

-20.6%

3/25/02

Sell

600.09

+70.71

+13.41%


7/25/02

Buy

454.36


-145.73

-27.5%

7/25/02

Buy

4804.28


-145.73

-27.5%

11/26/02

Sell

5111.34

+307.06

+6.4%


3/17/03

Buy

4783.95


-327.73

-6.8%

8/6/03

Sell

5460.91

+676.96

+14.2%


9/2/03

Buy

5660.16


+199.25

+3.6%

3/15/04

Sell

6545.96

+885.8

+15.6%


There is no assurance that our market timing signals will yield such consistent results in the future, but we will continue to update this chart to show the results on all of our signals in the future.

Notes:

1.  The New York Stock Exchange changed the numbering system for the NYSE Composite Index about 7/25/02 and that change is reflected above.

2.  A SELL signal was isued 3/24/03 that turned out to be an erroneous signal.  The market continued up until another sell signal was generated 8/6/03.  The signal model is designed to produce a SELL signal early in a market downturn to avoid signifcant losses.  In the extreme volatility following the war in Iraq the model reacted too soon as the market quickly corrected and continued up.
 
As a result of this experience, all signals in the future will be generated based on weekly data, thereby smoothing out the daily volatility and avoiding over-reaction to daily market swings.  Signals will be generated during the weekend followng the close of business on Friday.


FeldPro LLC * 102 Doral Lane * Hendersonville * TN * 37075