| December 18, 2003 |

|
| Chart courtesy of StockCharts.com |
Click on the chart above to view an up to date version of this three month NYSE Composite Index chart.
This chart includes a 20 day moving average and two sigma Bollinger Bands. Two sigma is defined by statisticians as the range that 97.6% of the price variation should fall in given the current variability of the price. When the price moves toward the edge of the bands it is signaling that something is influencing the price in the short term. This short term movement could be consistent with or counter to longer terms trends in the movement of the index.
If you're a subscriber, we'll let you know when our system produces a BUY or SELL signal. You'll be able to see the signals we use to get in and out of the market and follow our investment results from using these signals.
| January 26, 2003 |

|
| Chart courtesy of StockCharts.com |
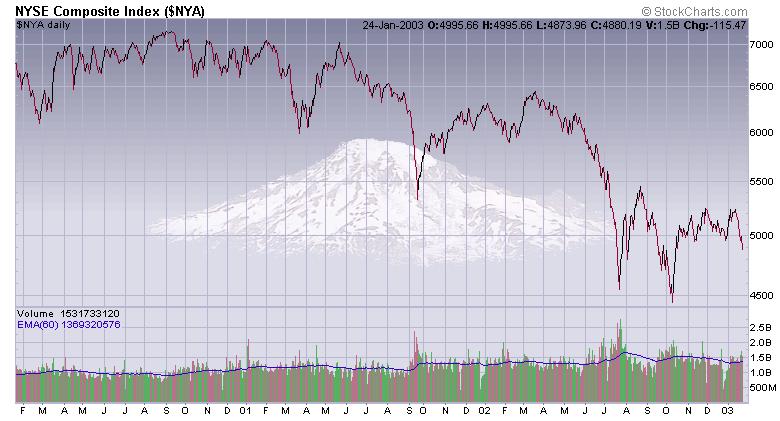
The three years prior to 2003 have not been good for the stock market. As you can see from the chart at the right, the oveall directon of the market has been down. Click on the graph at the right to see the current version of this chart.
The market seems to have bottomed and a new bull market is underway. There are many market experts who have a vested interest in getting us all to believe a bull market has begun. Maybe it has.
In reality, it's difficult to know when the market is in a short term correction and when it is in a longer term trend. We try to spot changes in direction of the market, regardless of their duration.
If you'd like to join us and get access to our signals as they are issued, go to the "Sign-up" page and subscribe. It only takes a minute, and for a limited time you get the first year's subscription free.
|