| Fairness |
Trustworthiness |
Kindness |
| Patience |
Gentleness |
Knowledge |
| Discipline |
Compassion |
Integrity |
Do unto others as you would have them do unto you

The majority of Tennesseans still don't get it. When 80% of the Tennessee population
see their incomes go down and 20% see their incomes go up, it's not because of a lack of effort on the part of the 80%.
It's the lack of a level playing field.
This growing inequality will have consequences.
Firstly, the economy depends on the buying power of the population. The 20% can only
buy so many Mac Mansions, Mercedes, and yachts. Without the spending of the 80%, the economy will grow slowly or
not at all.
Secondly, we all depend on the 80% to provide us with the goods and services we
need to live our everyday lives. Without enough income to afford a place to live and pay for everyday needs,
they cannot provide these services.
Thirdly, if the 80% can't see any way to get out of this group into the 20%, they have no
hope and some will give up trying to become productive citizens and instead will become a burden to the rest of
society.
There is far too much talk about the 80% being moochers and socialists and too little realization
that every single American is a recipient of government dollars in one way or another.
In fact, it seems to me that the biggest recipients are the richest and most powerful in
our country, including all of the businesses that depend on government contracts for their profits.
The recent loss in the Presidential race by the Republicans has been blamed on the majority
of the people getting aid from the Government and therefore were influenced to vote for the Democrats.
However, it appears that these voters are only asking for a level playing field that will
allow them the same opportunities the 20% enjoy.
The following article was in the Tennessean newspaper this morning and details
the growth of income inequality in Tennessee.
This article isn't about class envy or class warfare. It's just stating the facts. It's
becoming harder and harder for the 80% in Tennessee to get an even shot at success with the 20% who are in control creating
policies that result in the money flowing in their direction.

Income Inequality Grows in TN
Low, middle incomes have 'stagnated or declined' as richest 20 percent
grow wealthier
Incomes for the bottom 20 percent of Tennessee households fell by 12 percent over the course of nearly a decade, increasing
the gap between the state’s haves and have-nots, according to a new report.
The report by the Center on Budget and Policy Priorities and the Economic Policy Institute found income inequality grew
in 45 states, including Tennessee, between the late 1990s and the mid-2000s. Those were the last two periods when the economy
was at or near a peak, according to the authors, and therefore a fair framework for comparing income gaps.
Nationally, when adjusted for inflation to 2009 dollars, incomes dropped by 6 percent
for the average low-income family, the study found, and rose by 8.6 percent for the top 20 percent of households.
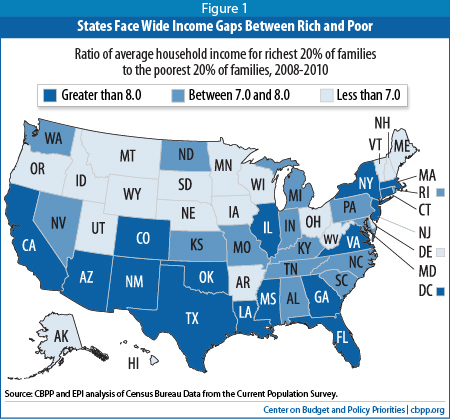
Average household income for the richest 20 percent of the state’s households from 2008 to 2010 was 7.8 times as
high as the average household income for the poorest 20 percent, giving Tennessee the 19th-widest gap in the nation, the study
says. New Mexico had the widest, 9.9 to 1.
“The lion’s share of growth has gone to the high end, whereas the incomes of low- and middle-income households
have stagnated or even declined,” said Doug Hall, a co-author of the report. “That’s clearly not a recipe
for shared prosperity.”
Hall said on a conference call with reporters from around the country Wednesday that income disparities were greatest in
the Southeast and Southwest because of those areas’ high concentrations of “traditional, low-wage nonunion jobs.”
Elizabeth McNichol, another co-author, said households on the bottom and middle steps of the American economic ladder have
struggled in an economic climate marked by long periods of high unemployment, which kept wages down; globalization, which
has forced U.S. workers to compete for jobs with workers in other countries; a shrinking pool of manufacturing jobs; and a
federal minimum wage that hasn’t kept pace with the cost of living.
McNichol said the income drop for Tennessee’s lowest earners was “very significant.” She said the lack
of a state income tax probably played a role in the advances made by the most prosperous residents compared with the poorest
ones.
“Tennessee does have a very regressive tax structure that would tend to widen the gap,” she said.
But the idea of implementing a state income tax has been a political dead letter since 2002, when protesters honked horns
outside the Capitol as the General Assembly considered legislation inside. Most candidates for legislative posts and the governor’s
office have refused to reconsider it.
“I’m going to leave it to some think tank up in D.C. to call our system regressive where the citizens get to
keep their money,” said state Rep. Kevin Brooks, R-Cleveland, the assistant House majority leader. “I kind of
think that’s the point.”
Contact Michael Cass at 615-259-8838 or mcass@tennessean.com.
Here's some more information from the report mentioned in the above article:

The gaps between the incomes of the richest
households and poor and middle-income households are wide and growing in most states, according to a major new report from
the Center on Budget and Policy Priorities and the Economic Policy Institute that examines inequality at the state level.
In the United States as a whole, the poorest
fifth of households had an average income of $20,510, while the top fifth had an average income of $164,490 — eight
times as much. In 15 states, this top-to-bottom ratio exceeded 8.0. In the late 1970s, in contrast, no state had a top-to-bottom ratio exceeding 8.0.
The average income of the top 5 percent of
households was 13.3 times the average income of the bottom fifth. The states
with the largest such gaps were Arizona, New Mexico, California, Georgia, and New York, where the ratio exceeded 15.0.
Top 5 Percent of Households Pulling
Away Even Faster
The widening income gap is even more pronounced
when one compares households in the top 5 percent of the income distribution to the bottom 20 percent over the last three
decades. We conducted this part of our analysis for the 11 large states
that have sufficient observations in the Current Population Survey to allow the comparison of the average income of the top
5 percent of households between different time periods.[2]
In these 11 large states, the average income
of the top 5 percent rose between the late 1970s and mid-2000s by more than $100,000, after adjusting for inflation . (In New Jersey and Massachusetts, the increase exceeded $200,000.) By contrast, the largest increase in average income for the bottom fifth of households in these states
was only $5,620. In New York, for example, average incomes grew by $194,000 among
the top 5 percent of households but by less than $250 among the bottom fifth of households.
In the 11 states, the incomes of the top 5
percent of households increased by 85 percent to 162 percent between the late 1970s and mid-2000s. By contrast, incomes of the bottom fifth of households didn’t grow by more than 27 percent in any
of these states, and in one state —Michigan – they actually fell.
The average income of the top 5 percent pulled
away from those in the middle as well. In the late 1970s, the incomes of the
top 5 percent were 2.5 to 3 times those of the middle fifth in these 11 states.
By the 2000s they were more than 4 times as much in all 11 states.
|